Have you ever wondered why two students can have the same average score, but one seems more consistent while the other’s scores swing dramatically?
The answer often lies in standard deviation. In statistics, standard deviation is a key measure that tells us how spread out a set of numbers is from the average. It’s not just a dry formula; it helps us understand variability in everything from exam results and sports performance to stock market trends and quality control in manufacturing.
By grasping the concept of standard deviation, you can make sense of patterns, identify consistency, and even assess risk in real-world situations. In this article, we’ll break down what standard deviation means, show how it’s calculated, and explain how to interpret it with practical examples.
Even if math isn’t your favorite subject, by the end, you’ll see how standard deviation is both simple and incredibly useful.
What is Standard Deviation?
At its core, standard deviation is a statistical measure that shows how much the numbers in a dataset differ from the average (mean). Simply put, it tells us how spread out or clustered the data is. If the numbers are all very close to the average, the standard deviation is low. If the numbers vary widely, the standard deviation is high.
For example, imagine two students, Alice and Bob, taking a five-test series. Alice scores 85, 86, 84, 85, and 86, while Bob scores 70, 90, 80, 100, and 60. Both have an average score of 85. However, Alice’s scores are very consistent, while Bob’s scores fluctuate dramatically. This difference in consistency is exactly what standard deviation measures.
Standard deviation is closely related to variance, which calculates the average squared difference from the mean. While variance gives a number in squared units (like points²), standard deviation brings it back to the original units, making it easier to interpret.
Understanding standard deviation is crucial because it helps us make sense of data beyond simple averages. For example, in finance, it shows how risky an investment is. In academics, it helps compare student performance. And in everyday life, it can explain why some things are more predictable than others. By learning this simple concept, you gain a powerful tool to understand patterns, variability, and reliability in any dataset.
How Standard Deviation is Calculated
Calculating standard deviation may sound complicated, but it becomes simple when broken into steps. Let’s go through it using a small dataset. Suppose you have five test scores: 80, 85, 90, 95, and 100.
Step 1: Find the mean (average)
Add all numbers and divide by the total count:
Mean=80+85+90+95+1005=4505=90\text{Mean} = \frac{80 + 85 + 90 + 95 + 100}{5} = \frac{450}{5} = 90Mean=580+85+90+95+100=5450=90
Step 2: Find the difference from the mean
Subtract the mean from each number:
- 80 − 90 = −10
- 85 − 90 = −5
- 90 − 90 = 0
- 95 − 90 = 5
- 100 − 90 = 10
Step 3: Square each difference
This removes negative numbers:
- (−10)² = 100
- (−5)² = 25
- 0² = 0
- 5² = 25
- 10² = 100
Step 4: Calculate the average of squared differences (variance)
Variance=100+25+0+25+1005=2505=50\text{Variance} = \frac{100 + 25 + 0 + 25 + 100}{5} = \frac{250}{5} = 50Variance=5100+25+0+25+100=5250=50
Step 5: Take the square root of variance
Standard Deviation=50≈7.07\text{Standard Deviation} = \sqrt{50} \approx 7.07Standard Deviation=50≈7.07
So, the standard deviation of these scores is about 7.07, showing the average amount each score deviates from the mean.
Understanding this process is helpful because it shows how data spreads around the average, not just what the average is. Once you master the steps, calculating standard deviation with larger datasets or using tools like Excel or Python becomes quick and easy.
Variance vs Standard Deviation
Variance and standard deviation are closely related concepts in statistics, but they serve slightly different purposes. Both measure how much data points deviate from the mean, yet they do it in different ways.
Variance calculates the average of the squared differences between each data point and the mean. By squaring the differences, it ensures that negative and positive deviations don’t cancel each other out. Using our earlier example of test scores (80, 85, 90, 95, 100), we found the variance to be 50. While variance tells us how data spreads, its units are squared (like points²), which can feel abstract and harder to interpret in real-world terms.
This is where standard deviation comes in. Standard deviation is simply the square root of variance, bringing the value back to the same unit as the original data. In our example, the standard deviation was approximately 7.07 points, making it easier to understand how far the scores typically stray from the average.
In simple terms, think of variance as the “rough measure of spread” and standard deviation as the “interpretable measure of spread.” While variance is important in calculations and advanced statistics, standard deviation is more intuitive for everyday use, reporting, and visual interpretation.
Understanding both helps you not only measure variability accurately but also communicate it clearly, whether you’re analyzing grades, stock performance, or experimental results.
Interpreting Standard Deviation
Understanding the number behind standard deviation is only part of the story. To truly use it, you need to know how to interpret it in real-world situations. Standard deviation tells us how spread out a set of numbers is from the average. A low standard deviation means most values are close to the mean, indicating consistency. A high standard deviation means values are more spread out, showing greater variability.
For example, imagine two classes taking the same test. In Class A, most students score between 88 and 92, with an average of 90. In Class B, scores range from 60 to 100, also averaging 90. Both classes have the same mean, but Class A has a low standard deviation, while Class B has a high standard deviation. This shows that the average alone can be misleading—standard deviation provides the context.
Standard deviation is also used to identify outliers. Data points far from the mean (more than 2 or 3 standard deviations away) are unusual and may need special attention. In finance, a stock with a high standard deviation is considered riskier because its price fluctuates more. In sports, a player with a low standard deviation in performance is consistent, while a high standard deviation indicates unpredictable performance.
By understanding standard deviation, you can make better decisions, whether analyzing grades, business metrics, or investment risks. It turns raw numbers into meaningful insights, helping you see patterns and consistency—or the lack of it—within any dataset.
Standard Deviation in Everyday Life
Standard deviation isn’t just a concept for math classrooms or statistics textbooks—it shows up in many aspects of our daily lives. Understanding it can help you interpret patterns, assess consistency, and make smarter decisions.
Take finance, for example. Investors use standard deviation to measure the risk of stocks or portfolios. A stock with a high standard deviation experiences large price swings, making it riskier. Conversely, a low standard deviation indicates steady performance, which can be ideal for cautious investors.
In academics, teachers use standard deviation to understand class performance. If most students score similarly on a test, the standard deviation is low, showing consistency. A high standard deviation indicates a wide range of scores, highlighting students who may need extra help or advanced challenges.
Even in sports, standard deviation can show a player’s reliability. For instance, a basketball player who scores roughly the same points each game has a low standard deviation, showing predictability. A player whose points vary widely has a high standard deviation, meaning their performance is inconsistent.
Other everyday uses include quality control in manufacturing, where standard deviation ensures products meet precise specifications, and weather analysis, where it measures variability in temperature or rainfall.
By observing standard deviation in daily contexts, we can see patterns beyond averages. It provides insight into consistency, reliability, and risk—helping us make informed decisions in everything from personal finance to sports, school, and business. Understanding it turns raw numbers into meaningful, actionable information.
Common Misconceptions About Standard Deviation
Despite being widely used, standard deviation is often misunderstood. Clearing up these misconceptions helps you use it correctly and interpret data more accurately.
1. Standard deviation measures error.
Many people mistakenly think that standard deviation tells you how “wrong” a measurement is. In reality, it measures variability or spread in the data, not error. A high standard deviation doesn’t mean the data is wrong; it just means the values are more spread out from the average.
2. Low standard deviation is always good.
A low standard deviation indicates consistency, but that doesn’t necessarily mean high performance. For example, if students all score low but consistently, the standard deviation is low, yet performance is poor. Conversely, a high standard deviation may be acceptable or even desirable in contexts like innovation or investment risk-taking.
3. Standard deviation equals risk in every situation.
While in finance a high standard deviation can indicate higher risk, this is context-dependent. In other areas, like sports or education, variability might be neutral or even informative, rather than inherently bad.
4. You can rely only on the mean and ignore standard deviation.
Looking at the average alone can be misleading. Two datasets can have the same mean but vastly different spreads, which is why standard deviation is crucial for context.
By understanding what standard deviation does—and does not—represent, you can avoid misinterpretations. It’s not about error, good or bad, or risk in every scenario; it’s about understanding how data behaves around the average, providing a clearer picture of variability and consistency.
Standard Deviation and the Normal Distribution
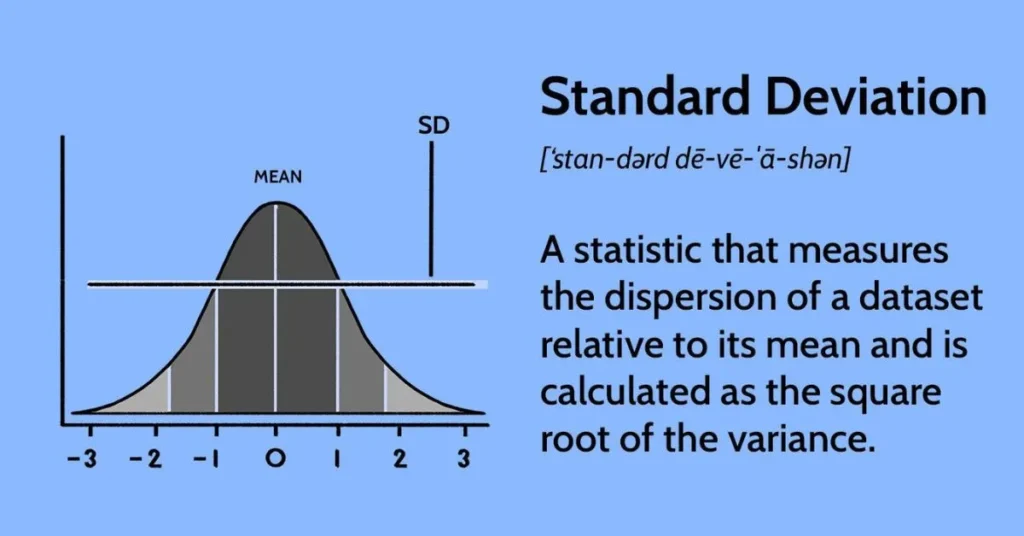
Standard deviation becomes even more meaningful when we look at it in the context of the normal distribution, also known as the bell curve. A normal distribution is a common way to represent data where most values cluster around the mean, and fewer values appear as you move further away.
In a normal distribution, the mean, median, and mode are all the same, and the curve is symmetrical. Standard deviation determines the spread of the curve. A small standard deviation produces a narrow, tall curve, showing that most data points are close to the average. A large standard deviation creates a wider, flatter curve, indicating that the data points are more spread out.
The empirical rule is often used with normal distributions:
- About 68% of data falls within 1 standard deviation of the mean.
- About 95% falls within 2 standard deviations.
- About 99.7% falls within 3 standard deviations.
For example, if the average test score in a class is 80 with a standard deviation of 5, approximately 68% of students scored between 75 and 85. Knowing this helps teachers, analysts, and researchers interpret the majority of data, spot outliers, and make informed decisions.
Understanding standard deviation in the context of the normal distribution allows us to visualize variability, identify patterns, and quantify how “typical” or “unusual” a value is. It turns abstract numbers into a clear picture of data behavior.
:
Tools and Software to Calculate Standard Deviation
Calculating standard deviation by hand is a great way to understand the concept, but for larger datasets, it can become time-consuming. Fortunately, there are many tools and software options that make the process fast and accurate.
1. Excel and Google Sheets
Both Excel and Google Sheets have built-in functions to calculate standard deviation. For a dataset in Excel, you can use =STDEV.S(range) for a sample or =STDEV.P(range) for an entire population. These formulas automatically handle all the steps, including calculating the mean, differences, squaring, and averaging. Google Sheets uses similar functions.
2. Python and R
For data analysis and programming, Python and R are powerful tools. In Python, the statistics module provides stdev() for samples and pstdev() for populations. In R, you can use the sd() function. These tools are especially useful when working with large datasets, automating calculations, and even creating visualizations.
3. Online Calculators
There are countless free online calculators where you simply enter your data, and the standard deviation is calculated instantly. While convenient for quick checks, they may lack context, so understanding the underlying calculation is still important.
4. Statistical Software
Software like SPSS, SAS, and Minitab are commonly used in research and business to calculate standard deviation and perform advanced statistical analysis. These programs also provide graphs, charts, and detailed interpretations.
Using these tools allows you to handle real-world datasets quickly while ensuring accuracy. Even if you rely on technology, knowing how standard deviation is calculated ensures you can interpret results correctly and make informed decisions.
Key Takeaways
Standard deviation is a fundamental concept in statistics that goes far beyond numbers on a page. It measures how much data points deviate from the mean, giving insight into variability, consistency, and spread within a dataset. While the mean tells us the “average,” standard deviation tells us how reliable or predictable that average is.
A low standard deviation indicates that data points are clustered closely around the mean, showing consistency. A high standard deviation shows greater variability, meaning values are more spread out. This concept applies to many real-world contexts: in finance, it measures investment risk; in academics, it shows student performance consistency; in sports, it identifies reliability or unpredictability; and in manufacturing, it ensures product quality.
It’s also important to understand common misconceptions: standard deviation does not measure error, high values are not inherently “bad,” and the mean alone cannot give the full picture of a dataset. By combining standard deviation with other statistics, you gain a clear understanding of how data behaves.
Whether you calculate it by hand, use Excel, or rely on programming tools like Python or R, understanding standard deviation empowers you to interpret data meaningfully. From spotting trends and outliers to making informed decisions, this simple yet powerful measure transforms raw numbers into actionable insights.
By mastering standard deviation, you not only understand statistics better but also gain a tool that applies to everyday life, business, academics, and beyond.
Advanced Applications of Standard Deviation
Beyond everyday examples, standard deviation plays a crucial role in advanced statistics, data analysis, and decision-making. In scientific research, it helps quantify uncertainty and reliability in experiments, allowing researchers to understand variability in measurements and results. For instance, in clinical trials, a small standard deviation in patient responses can indicate consistent drug effectiveness, while a high standard deviation may reveal unpredictable outcomes.
In business analytics, companies use standard deviation to monitor trends, control quality, and optimize operations. For example, a factory tracking production output may use standard deviation to detect deviations from the desired standard, identifying problems early and reducing waste.
In finance, standard deviation is part of modern portfolio theory, where it measures volatility and informs investment strategies. Investors often balance high-risk, high-reward assets (with large standard deviations) against low-risk, stable assets (with small standard deviations) to optimize returns while managing risk.
Even in machine learning and artificial intelligence, standard deviation is critical in data preprocessing. Features with high variability may need normalization or standardization to improve model performance.
Understanding these advanced applications shows that standard deviation is not just a classroom concept—it is a powerful analytical tool used across science, finance, business, and technology. Mastering it allows you to interpret data accurately, make informed decisions, and solve real-world problems with confidence.
Real-World Examples: Understanding Standard Deviation in Action
To truly appreciate standard deviation, it helps to see it in real-world scenarios. Consider a company monitoring daily website traffic. If the average visitors per day is 5,000 and the standard deviation is 100, most days see traffic between 4,900 and 5,100 visitors—a consistent and predictable pattern. However, if the standard deviation jumps to 1,000, traffic fluctuates between 4,000 and 6,000 visitors, indicating high variability and potential issues in marketing or user engagement.
In sports, coaches use standard deviation to analyze performance consistency. For example, a soccer player’s goals per season might average 10, but if the standard deviation is 1, the player consistently scores around 10 goals. If the standard deviation is 5, the player might score 5 goals one season and 15 the next, showing unpredictable performance.
In personal finance, standard deviation helps assess investment risk. A stock with high standard deviation is more volatile—prices swing dramatically, meaning higher potential gains but also higher potential losses. Low standard deviation indicates stable returns, appealing to risk-averse investors.
Even education benefits: teachers analyzing test scores can identify classes with unusually high or low variation, informing whether interventions or enrichment are needed.
These examples show that standard deviation is more than a formula—it’s a practical tool for understanding patterns, making decisions, and predicting outcomes. By connecting numbers to real-life situations, standard deviation transforms abstract data into actionable insights that anyone can understand and use.
Tips for Using Standard Deviation Effectively
Understanding standard deviation is one thing, but using it effectively can make your data analysis far more insightful. Here are some practical tips to get the most out of this powerful statistical tool.
1. Always consider the context.
A high or low standard deviation is meaningful only relative to your dataset and field. For example, a high standard deviation in test scores may indicate inequality in preparation, while the same value in stock returns may signal high-risk investment opportunities.
2. Combine it with the mean.
Standard deviation alone doesn’t tell the full story. Always consider it alongside the average to understand both the central tendency and the variability of your data.
3. Use visual aids.
Graphs like histograms, bell curves, and scatter plots can make standard deviation easier to interpret. Visualizing data helps identify patterns, clusters, and outliers quickly.
4. Check for outliers.
Extreme values can inflate standard deviation and misrepresent data spread. Identify outliers separately and decide whether to include them in analysis depending on your goal.
5. Leverage tools for accuracy.
Software like Excel, Google Sheets, Python, and R can calculate standard deviation quickly, especially for large datasets. Ensure you understand the formulas (STDEV.S vs STDEV.P) to avoid mistakes.
6. Apply it across fields.
Whether in finance, education, sports, or manufacturing, using standard deviation appropriately helps assess risk, consistency, and reliability, turning numbers into actionable insights.
By following these tips, you can interpret, visualize, and communicate variability effectively, making standard deviation a practical tool for decision-making in everyday life and professional contexts.
Common Pitfalls to Avoid with Standard Deviation
While standard deviation is a powerful tool, it’s easy to misuse or misinterpret it if you’re not careful. Being aware of common pitfalls can help you make better decisions and avoid misleading conclusions.
1. Ignoring the dataset size.
Standard deviation is sensitive to the number of data points. Small datasets may give misleadingly high or low values, so always consider whether your dataset is large enough to draw meaningful conclusions.
2. Overlooking outliers.
Extreme values can drastically increase standard deviation, making variability seem higher than it really is. Always check for outliers and decide whether to include them based on your analysis goals.
3. Relying solely on standard deviation.
Using standard deviation without considering the mean or the shape of the data can be misleading. Two datasets may have the same standard deviation but very different patterns. Always look at the bigger picture.
4. Confusing population vs sample formulas.
There are two formulas for standard deviation: one for an entire population (STDEV.P) and one for a sample (STDEV.S). Using the wrong formula can produce inaccurate results, especially in research or business reporting.
5. Misinterpreting high or low values.
A high standard deviation does not automatically mean “bad,” and a low standard deviation is not always “good.” Interpret values relative to your context and the goals of your analysis.
By avoiding these pitfalls, you ensure that your use of standard deviation remains accurate and meaningful, turning raw numbers into clear insights that guide better decisions across academics, finance, business, and everyday life.
Why Standard Deviation Matters
Standard deviation is more than just a mathematical formula—it’s a key tool for understanding and interpreting data. By measuring how much values deviate from the mean, it gives insight into variability, consistency, and reliability, which are critical in almost every field.
In finance, standard deviation helps investors assess risk. A stock with high standard deviation may offer higher potential returns but comes with more volatility, while a low standard deviation stock is steadier and less risky. Understanding this can guide smarter investment choices.
In academics, standard deviation helps teachers and administrators interpret student performance. Two classes may have the same average score, but a high standard deviation indicates that students’ results vary widely, highlighting the need for additional support or challenges.
In science and research, standard deviation quantifies uncertainty. Experiments with small standard deviations suggest consistent, reliable results, while larger deviations may signal variability or the need for further investigation.
Even in daily life, standard deviation helps make sense of everyday patterns, from sports statistics and weather changes to quality control in products. It allows us to move beyond averages, identifying trends, spotting outliers, and understanding real-world variability.
Ultimately, standard deviation matters because it turns raw numbers into actionable insights. It provides a deeper understanding of data, enabling better decisions, clearer communication, and more accurate predictions. By mastering standard deviation, you gain a tool that applies across academics, business, finance, science, and everyday life, making data meaningful instead of just numbers on a page.
Using Standard Deviation to Identify Outliers
One of the most practical uses of standard deviation is detecting outliers—data points that differ significantly from the rest of the dataset. Outliers can reveal important insights or signal errors, making standard deviation a valuable tool for analysis.
A common rule of thumb is that any value more than 2 or 3 standard deviations away from the mean may be considered an outlier. For example, imagine a company tracking daily sales. If the average daily revenue is $10,000 with a standard deviation of $500, most days’ sales will fall between $9,000 and $11,000. A day with $12,500 in sales would be unusually high—more than 3 standard deviations above the mean—highlighting an outlier worth investigating.
Outliers are not necessarily “bad.” In finance, an unusually high return could be a rare opportunity. In quality control, it could signal a defective product that needs attention. In sports, a player’s record-breaking performance might be an outlier that shows exceptional skill rather than inconsistency.
Using standard deviation to identify outliers also improves data analysis accuracy. Ignoring extreme values can mislead averages, while understanding them helps make better decisions.
By learning how to spot outliers with standard deviation, you gain a powerful way to understand patterns, anomalies, and risks in datasets. It turns raw numbers into actionable insights, whether you’re analyzing business metrics, scientific experiments, or everyday statistics.
Standard Deviation in Risk Management
Standard deviation is a cornerstone of risk management across industries, helping organizations and individuals make informed decisions by quantifying uncertainty and variability. By understanding how much outcomes can deviate from the expected average, risk managers can prepare for both common fluctuations and rare extreme events.
In finance, standard deviation measures the volatility of investments. Stocks or portfolios with higher standard deviation are more unpredictable, presenting greater potential for profit—but also greater risk of loss. Risk managers use this metric to balance portfolios, diversify assets, and make strategic decisions that align with their risk tolerance. For example, a retirement fund may favor low standard deviation investments to ensure steady returns.
In business operations, standard deviation helps monitor variability in production, sales, or supply chain processes. A high standard deviation in production times may indicate inefficiencies or quality issues, prompting corrective actions before they escalate into costly problems.
Even in insurance, standard deviation helps assess risk exposure and calculate premiums. Policies for high-risk clients or events—like natural disasters or health risks—are priced using statistical models that rely on standard deviation to estimate variability and potential losses.
By incorporating standard deviation into risk management, organizations can anticipate variability, identify outliers, and make data-driven decisions rather than relying on intuition alone. It provides a clear measure of uncertainty, turning complex datasets into actionable insights, whether in finance, business operations, or insurance. Understanding this tool allows for smarter planning, better resource allocation, and more effective mitigation of potential risks.
Visualizing Standard Deviation with Graphs and Charts
Understanding standard deviation becomes much easier when you visualize data. Graphs and charts help turn abstract numbers into clear, interpretable patterns, making it easier to identify variability, trends, and outliers.
One of the most common visualizations is the bell curve, or normal distribution graph. The peak represents the mean, and the spread shows the standard deviation. A narrow, tall curve indicates a low standard deviation, meaning data points are closely clustered around the mean. A wider, flatter curve shows a high standard deviation, indicating more variability. By adding shaded regions for 1, 2, and 3 standard deviations from the mean, you can quickly see where most data points fall.
Histograms are another useful tool. They display the frequency of data points in intervals, making it easy to observe clustering and spread. Overlaying a curve or marking the mean and standard deviations can make patterns even clearer.
Box plots also help visualize variability. The interquartile range represents the middle 50% of data, while whiskers and outliers highlight extreme values. Standard deviation complements these visuals by quantifying spread numerically.
Even in business dashboards, line charts with error bars or shaded regions indicate variability over time. This allows decision-makers to quickly assess consistency and spot unusual fluctuations.
By combining standard deviation with visualizations, you turn raw numbers into actionable insights. Graphs make it easier to communicate findings, spot trends, identify outliers, and make informed decisions in finance, education, research, or everyday life.
Standard Deviation in Education and Testing
Standard deviation plays a crucial role in education and testing, helping teachers, administrators, and policymakers understand student performance beyond simple averages. While the mean provides a general idea of how a class performed, standard deviation reveals variability and consistency in scores.
For example, two classes may have an average test score of 80. However, if one class has a low standard deviation, most students scored close to 80, indicating consistent performance. If the other class has a high standard deviation, scores vary widely, suggesting some students excelled while others struggled. This information allows teachers to target interventions, offer extra support, or provide enrichment programs tailored to student needs.
Standard deviation is also used in standardized testing, such as SATs or IQ tests. It ensures scores are distributed meaningfully across the population, allowing educators and psychologists to compare individual performance relative to peers. A student who scores one standard deviation above the mean is performing better than roughly 84% of test-takers.
In grading, understanding standard deviation can help prevent misleading interpretations. For example, a high mean with a high standard deviation may indicate achievement gaps, while a low mean with low standard deviation may show uniform but underwhelming performance.
By using standard deviation in education, teachers and administrators gain insightful, actionable data. It helps evaluate teaching effectiveness, assess fairness, identify gaps, and support informed decisions that improve learning outcomes for all students.
Common Mistakes When Using Standard Deviation in Analysis
While standard deviation is a powerful statistical tool, analysts often make mistakes that can lead to misinterpretation or incorrect conclusions. Being aware of these pitfalls ensures accurate and meaningful results.
1. Confusing population and sample standard deviation.
There are two formulas: one for an entire population (STDEV.P) and one for a sample (STDEV.S). Using the wrong formula can distort results, especially in research or business analysis where accuracy matters.
2. Ignoring the context of the data.
A high or low standard deviation is meaningful only relative to the dataset. For instance, high variability may indicate risk in finance, but in creative fields, it could represent innovation or diversity. Without context, interpretation can be misleading.
3. Overlooking outliers.
Extreme values can drastically affect standard deviation. Including outliers without considering their impact may make variability seem larger than it truly is. Conversely, ignoring genuine outliers can hide critical insights.
4. Relying solely on standard deviation.
Standard deviation should not replace other statistical measures. Combining it with the mean, median, and visualizations provides a clearer picture of data distribution and patterns.
5. Misinterpreting results as inherently good or bad.
A low standard deviation isn’t always positive, nor is a high one inherently negative. Interpretation depends on goals, expectations, and the nature of the data.
Avoiding these mistakes ensures that standard deviation serves its purpose: providing meaningful insights into data variability. By applying it correctly, analysts, educators, business managers, and researchers can make informed decisions and avoid misleading conclusions.
Standard Deviation in Scientific Research
In scientific research, standard deviation is a critical tool for measuring variability and reliability in experimental data. Scientists rarely rely solely on averages because mean values can hide important differences among measurements. Standard deviation provides a deeper understanding of how consistent results are across trials or observations.
For example, in a laboratory experiment measuring the growth of plants under controlled conditions, researchers may record the heights of multiple plants. If the mean height is 15 cm with a small standard deviation, it indicates that most plants grew consistently. A large standard deviation, however, would suggest significant variation, potentially highlighting errors in procedure, environmental factors, or biological differences.
Standard deviation is also essential in reporting scientific results. When publishing studies, researchers often present the mean ± standard deviation to communicate both central tendency and variability. This allows peers to assess the reliability of the findings and compare results across different studies.
In fields like medicine, chemistry, and physics, standard deviation is used to analyze measurement precision, detect anomalies, and support hypothesis testing. It plays a key role in statistical tests, such as t-tests and ANOVA, which determine whether observed differences are statistically significant or likely due to random chance.
By incorporating standard deviation, scientists can ensure their research is robust, transparent, and reproducible. It provides a quantitative measure of uncertainty, helping researchers draw accurate conclusions, improve experimental design, and advance knowledge across disciplines.
Standard Deviation in Business Analytics
In business analytics, standard deviation is a key tool for understanding variability in data and making informed decisions. It helps managers, analysts, and decision-makers assess performance, monitor trends, and plan strategically.
For example, consider a retail company tracking daily sales. If the average daily revenue is $50,000 with a low standard deviation of $2,000, sales are consistent and predictable. A high standard deviation, such as $10,000, indicates significant fluctuations, prompting managers to investigate factors like marketing campaigns, seasonal demand, or supply chain issues.
Standard deviation is also widely used in customer behavior analysis. Businesses can measure variability in purchase frequency, spending habits, or engagement metrics. High variability may signal diverse customer needs, while low variability indicates uniform behavior. This insight allows companies to tailor marketing strategies, create targeted promotions, and improve customer retention.
In financial analysis, standard deviation is crucial for assessing risk. Investment portfolios with high standard deviation are more volatile, while low standard deviation portfolios offer stable returns. Companies use this information to balance risk and reward, optimize resource allocation, and plan long-term strategies.
Even in operations and quality management, standard deviation helps monitor consistency in production processes. Products with low variability meet standards reliably, while high variability may indicate defects or inefficiencies that require corrective action.
By applying standard deviation in business analytics, organizations can transform raw data into actionable insights, identify patterns, mitigate risks, and make data-driven decisions that improve performance and competitiveness across departments.
Standard Deviation in Sports Performance Analysis
In sports, standard deviation is a valuable tool for evaluating athlete consistency and performance variability. Coaches, analysts, and scouts use it to understand patterns, identify strengths and weaknesses, and make strategic decisions.
For example, consider a basketball player who scores an average of 20 points per game. If the standard deviation is low, say 2 points, the player consistently scores close to 20 points every game. A high standard deviation, such as 8 points, indicates unpredictable performance, with some games far above or below the average. This insight helps coaches decide when to rely on the player in critical situations or adjust training strategies to improve consistency.
Standard deviation is also used to compare players or teams. Two athletes may have the same average performance, but the one with a lower standard deviation is generally more reliable. In team sports, understanding variability helps managers plan rotations, balance lineups, and predict outcomes with greater accuracy.
Beyond individual performance, standard deviation can track seasonal or match-to-match consistency for entire teams. For example, a soccer team with high scoring variability might struggle against certain opponents or under pressure, while a team with low variability maintains steady results.
Sports analysts also apply standard deviation in advanced metrics, such as player efficiency ratings, shot accuracy, or speed and endurance tracking. By quantifying performance variability, standard deviation provides actionable insights that improve training, strategy, and overall competitiveness.
In short, standard deviation transforms raw sports data into a clear picture of consistency, reliability, and potential risk, helping teams and athletes perform at their best.
Standard Deviation in Healthcare and Medicine
In healthcare and medicine, standard deviation is an essential tool for analyzing patient data, medical tests, and treatment outcomes. It allows doctors, researchers, and administrators to understand variability, assess reliability, and make informed decisions.
For example, consider blood pressure measurements in a group of patients. If the mean systolic blood pressure is 120 mmHg with a low standard deviation, most patients’ readings are close to 120, indicating consistent health status. A high standard deviation, however, shows wide variations, highlighting individuals at risk or requiring closer monitoring.
Standard deviation is also critical in clinical trials. Researchers use it to measure the consistency of treatment effects across participants. A drug with low variability in outcomes demonstrates predictable effectiveness, while high variability may indicate differing responses due to genetics, lifestyle, or other factors. This information guides dosing, patient selection, and safety protocols.
In diagnostic testing, standard deviation helps interpret lab results. For example, cholesterol, blood sugar, or hormone levels are compared against population norms. Understanding variability ensures that abnormal values are correctly identified without overreacting to minor fluctuations.
Even in hospital operations, standard deviation measures variability in patient wait times, treatment durations, or resource usage, helping administrators improve efficiency and patient care.
By incorporating standard deviation, healthcare professionals can detect patterns, predict risks, and improve treatment outcomes. It transforms raw medical data into actionable insights, ensuring safer, more effective, and personalized care for patients.
Standard Deviation in Weather and Climate Analysis
Standard deviation is a powerful tool in weather and climate analysis, helping meteorologists, scientists, and researchers understand variability in environmental data. It measures how much daily, monthly, or yearly weather values deviate from the average, providing insight into patterns, anomalies, and climate trends.
For example, consider average daily temperatures in a city over a month. If the mean temperature is 25°C with a low standard deviation, most days are close to 25°C, indicating stable weather. A high standard deviation, however, shows wide fluctuations—some days may be very hot, others unusually cool. This information is crucial for planning, agriculture, energy management, and public safety.
Standard deviation also plays a key role in extreme weather analysis. Meteorologists use it to identify outliers, such as record-breaking heatwaves or unusually cold periods. By quantifying variability, they can distinguish between normal seasonal changes and abnormal events that require warnings or interventions.
In climate research, standard deviation helps track long-term trends and variability in temperature, rainfall, sea levels, and other indicators. High variability in a region may suggest susceptibility to droughts, floods, or other climate risks, while low variability indicates relative stability.
Even in daily life, understanding weather variability allows individuals and businesses to plan activities, manage resources, and prepare for unexpected changes. By using standard deviation in weather and climate analysis, scientists turn raw data into meaningful insights, enabling better predictions, informed decisions, and improved preparedness for both short-term and long-term environmental changes.
Standard Deviation in Quality Control
Standard deviation is a cornerstone of quality control in manufacturing and production processes. It measures the variability of product characteristics—such as size, weight, or strength—helping ensure consistency and maintain standards.
For example, a factory producing screws may aim for a length of 5 cm. If the standard deviation is low, most screws are very close to 5 cm, indicating consistent production. A high standard deviation, however, shows greater variability, meaning some screws are too short or too long, potentially causing defects or assembly problems. By monitoring standard deviation, manufacturers can detect inconsistencies early and take corrective action before faulty products reach customers.
Standard deviation is often used in control charts, which track production metrics over time. These charts display the mean, standard deviation, and acceptable tolerance limits, allowing quality managers to quickly identify trends, anomalies, or process shifts.
It also helps in process improvement initiatives. For instance, a company may adjust machinery, optimize materials, or refine techniques to reduce standard deviation, ensuring products meet specifications more reliably.
Even beyond manufacturing, standard deviation aids in service quality management, such as measuring variability in response times, customer satisfaction, or delivery performance.
By applying standard deviation in quality control, businesses maintain product consistency, improve reliability, and reduce waste. It transforms raw measurements into actionable insights, enabling companies to uphold high standards, satisfy customers, and remain competitive in the market.
Standard Deviation in Economics and Market Analysis
In economics and market analysis, standard deviation is a vital tool for understanding variability, risk, and trends. It provides insight into how much economic indicators or financial metrics fluctuate around an average, helping analysts, investors, and policymakers make informed decisions.
For example, consider the daily returns of a stock. If the average daily return is 0.5% with a low standard deviation, the stock performs consistently with minimal fluctuations. A high standard deviation, however, indicates volatile performance, signaling higher risk for investors. Standard deviation helps portfolio managers balance high-risk and low-risk assets to optimize returns while managing exposure.
Economists also use standard deviation to analyze inflation rates, unemployment levels, or GDP growth. High variability in these indicators may suggest economic instability, while low variability signals predictability and steadiness in the economy. Policymakers can use this data to adjust fiscal or monetary policies, aiming to stabilize markets and reduce uncertainty.
In market research, standard deviation measures variability in consumer behavior, sales, and pricing. A product with highly variable sales may require different marketing strategies than one with consistent sales patterns. Similarly, standard deviation helps businesses understand price fluctuations and demand trends, allowing better forecasting and planning.
By quantifying variability, standard deviation transforms complex economic and market data into actionable insights. It enables investors, analysts, and decision-makers to evaluate risk, detect anomalies, and make data-driven choices, ultimately improving financial stability, efficiency, and strategic planning in dynamic economic environments.
Standard Deviation in Psychology and Behavioral Studies
In psychology and behavioral studies, standard deviation is essential for understanding variability in human behavior, test scores, and experimental results. It helps researchers determine how consistent or diverse responses are within a group, providing deeper insight beyond simple averages.
For example, in intelligence testing, a group of participants may have an average IQ of 100. A low standard deviation indicates most participants scored near 100, showing consistent cognitive abilities across the group. A high standard deviation, however, reflects a wider spread of scores, revealing greater diversity in intelligence levels. This information is critical for interpreting results, identifying outliers, and understanding population differences.
Standard deviation also helps in behavioral experiments, where researchers measure reaction times, decision-making patterns, or emotional responses. By analyzing variability, psychologists can assess whether observed effects are consistent or if they differ significantly among participants, which can influence conclusions about human behavior.
In clinical psychology, standard deviation informs assessments of conditions such as anxiety, depression, or learning disabilities. Scores that deviate significantly from the mean may identify individuals who need interventions or tailored treatment plans.
Furthermore, in social psychology, it helps measure variability in survey responses, attitudes, or preferences, providing insights into group dynamics, consensus, or disagreement.
By applying standard deviation in psychology, researchers gain a quantitative understanding of human variability, allowing more accurate interpretations, reliable conclusions, and effective interventions. It transforms raw behavioral data into meaningful insights that inform both theory and practice.
Standard Deviation in Technology and Data Science
In technology and data science, standard deviation is a critical tool for analyzing data, assessing variability, and improving models. It allows engineers, analysts, and data scientists to understand patterns, detect anomalies, and make informed predictions.
For example, in web analytics, standard deviation measures fluctuations in website traffic. A low standard deviation indicates consistent user activity, while a high standard deviation highlights unpredictable traffic spikes or drops. Understanding this variability helps optimize server resources, marketing campaigns, and user experience.
In machine learning and AI, standard deviation is used during data preprocessing. Features with high variability may need normalization or standardization to ensure models perform accurately. It also helps detect outliers that could distort training and prediction results.
In software performance testing, standard deviation measures the variability of response times or processing speeds. A low standard deviation signals stable performance, while high variability may indicate bugs, bottlenecks, or infrastructure issues.
Standard deviation also plays a role in big data analysis, where massive datasets contain billions of entries. Analysts use it to quantify trends, identify anomalies, and validate models, ensuring insights are reliable and actionable.
By incorporating standard deviation, data professionals can quantify uncertainty, assess consistency, and improve decision-making. Whether optimizing software, analyzing user behavior, or training AI models, standard deviation transforms raw data into meaningful information, enabling better predictions, efficient resource management, and smarter technology-driven solutions.
Standard Deviation in Finance and Investment Strategy
In finance, standard deviation is a fundamental metric for measuring risk and volatility in investments. It allows investors, portfolio managers, and analysts to evaluate how much an asset’s returns deviate from the expected average, helping guide strategic decisions.
For example, consider two stocks with the same average annual return of 8%. Stock A has a low standard deviation, meaning its returns stay close to 8% each year, offering stability and predictability. Stock B has a high standard deviation, with returns swinging widely between 2% and 14%. While both stocks have the same average, Stock B carries higher risk due to its variability, which investors need to consider based on their risk tolerance.
Standard deviation is also critical in portfolio management. By analyzing the volatility of multiple assets, investors can diversify holdings to minimize risk while targeting desired returns. Portfolios with lower overall standard deviation tend to be more stable, while higher standard deviation portfolios offer greater potential gains but with increased exposure to market fluctuations.
In risk assessment, standard deviation helps identify extreme events, like market crashes or unexpected losses. It provides quantitative insight into the likelihood of deviations from expected returns, allowing investors to plan strategies, hedge risks, or adjust positions accordingly.
Furthermore, standard deviation is often combined with other metrics, like beta and Sharpe ratio, to evaluate risk-adjusted performance. By using standard deviation effectively, investors can make data-driven decisions, balance risk and reward, and optimize long-term financial strategies.
Standard Deviation in Engineering and Manufacturing
In engineering and manufacturing, standard deviation is a key tool for ensuring quality, precision, and consistency in products and processes. It measures how much individual measurements deviate from the average, helping engineers maintain high standards and identify areas for improvement.
For example, consider a factory producing metal rods with a target length of 10 cm. If the standard deviation is low, most rods are very close to 10 cm, indicating precise manufacturing. A high standard deviation, however, means rod lengths vary widely, which could result in defective products or assembly issues. Monitoring standard deviation allows engineers to detect inconsistencies early and adjust machinery, materials, or processes to improve reliability.
Standard deviation is also critical in process control and optimization. Engineers use control charts to track production metrics over time, marking the mean, standard deviation, and acceptable limits. This helps identify trends, anomalies, or shifts in the process, enabling corrective actions before defects become widespread.
In addition, standard deviation assists in safety and performance testing. For example, in aerospace engineering, the variability in stress tests or material strength is measured to ensure components meet rigorous safety standards.
Even in service engineering, it helps track variability in maintenance times, machine performance, or production speed.
By applying standard deviation in engineering and manufacturing, companies can improve product quality, reduce waste, and enhance operational efficiency. It transforms raw measurements into actionable insights, ensuring processes remain consistent, reliable, and cost-effective.
Standard Deviation in Marketing and Consumer Analysis
In marketing and consumer analysis, standard deviation is a powerful tool for understanding variability in customer behavior, sales trends, and campaign performance. It helps marketers make data-driven decisions and optimize strategies for maximum impact.
For example, consider daily sales of a product. If the average daily sales are 500 units with a low standard deviation, sales are consistent and predictable. A high standard deviation, however, shows wide fluctuations, indicating that some days significantly outperform others. Understanding this variability allows marketers to investigate causes, such as promotions, seasonal trends, or external factors, and adjust campaigns accordingly.
Standard deviation is also crucial in market research. Surveys often measure preferences, satisfaction, or brand perception. A low standard deviation in survey responses indicates general agreement among participants, while a high standard deviation reflects diverse opinions. This insight helps businesses segment audiences, tailor messaging, and design products that meet customer needs.
In digital marketing, standard deviation can track engagement metrics such as click-through rates, conversion rates, or social media interactions. High variability might reveal which campaigns resonate with different segments, guiding targeted strategies.
Even in pricing analysis, standard deviation helps identify products with volatile demand or price sensitivity. Businesses can adjust pricing, inventory, or promotions to optimize profitability.
By applying standard deviation in marketing, companies gain a clearer understanding of patterns, trends, and variability in consumer behavior. This allows for smarter targeting, more effective campaigns, and better decision-making, turning data into actionable insights that drive growth and customer satisfaction.
Standard Deviation in Environmental Science
In environmental science, standard deviation is an essential tool for analyzing variability in natural phenomena and understanding patterns in ecosystems, pollution, and climate. It allows researchers to quantify differences and make informed decisions about conservation and resource management.
For example, consider measurements of air pollution levels in a city. If the average particulate matter (PM2.5) concentration is 50 µg/m³ with a low standard deviation, pollution levels are relatively stable. A high standard deviation, however, indicates wide fluctuations, which may signal health risks or the need for targeted interventions in specific areas.
Standard deviation is also critical in water quality monitoring. Scientists measure parameters like pH, dissolved oxygen, and contaminants across multiple sites. Low standard deviation suggests uniform water quality, while high variability highlights areas requiring attention or further study.
In ecology, standard deviation helps track biodiversity and population distributions. For example, the average number of a species in different regions may be similar, but a high standard deviation indicates that some regions have very few individuals, while others have many. This information guides conservation efforts and habitat management.
Even in climate science, standard deviation measures variability in temperature, rainfall, or sea levels over time. It helps scientists identify unusual trends, extreme weather events, and potential risks to ecosystems and human populations.
By applying standard deviation, environmental scientists can interpret complex datasets, detect anomalies, and plan effective interventions. It transforms raw measurements into actionable insights, improving environmental management, conservation strategies, and public health protection.
Standard Deviation in Transportation and Logistics
Standard deviation is a critical tool in transportation and logistics, helping companies analyze variability, improve efficiency, and enhance service reliability. It measures how much data, such as delivery times, travel durations, or fuel consumption, deviates from the average.
For example, consider a delivery company tracking daily shipping times. If the average delivery time is 2 hours with a low standard deviation, most packages arrive consistently on schedule. A high standard deviation indicates that some deliveries are much faster or slower than average, signaling potential inefficiencies in routing, traffic management, or operational planning.
Standard deviation also aids in fleet management. Monitoring fuel consumption, vehicle speeds, and maintenance intervals allows logistics managers to identify anomalies, optimize performance, and reduce costs. Vehicles with highly variable fuel efficiency or travel times may require inspection or scheduling adjustments.
In supply chain management, standard deviation helps track variability in inventory turnover, order fulfillment, and supplier performance. High variability in supply chain metrics can indicate bottlenecks, delays, or unreliable partners, while low variability suggests a stable and efficient process.
Even in public transportation, standard deviation measures consistency in arrival and departure times. Transit authorities use it to improve scheduling, reduce delays, and enhance passenger satisfaction.
By using standard deviation in transportation and logistics, companies can identify inconsistencies, optimize operations, and make data-driven decisions. It transforms raw numbers into actionable insights, enabling smoother workflows, cost savings, and better service quality for both businesses and customers.
Standard Deviation in Agriculture and Farming
In agriculture and farming, standard deviation is a valuable tool for measuring variability, optimizing yields, and managing resources. It helps farmers, agronomists, and researchers understand patterns in crop production, soil quality, and environmental conditions.
For example, consider a farm measuring the yield of corn across different fields. If the average yield is 200 bushels per acre with a low standard deviation, most fields produce similar results, indicating uniform soil quality, irrigation, and farming practices. A high standard deviation, however, shows wide variability in yields, suggesting differences in soil fertility, water availability, or pest management that need attention.
Standard deviation is also used in weather and climate analysis for agriculture. By measuring variability in rainfall, temperature, or sunlight, farmers can plan irrigation schedules, planting times, and crop selection to reduce risks from unpredictable conditions.
In soil testing and nutrient management, standard deviation highlights variability in nutrient levels across fields. Low variability indicates consistent soil health, while high variability helps identify areas that require fertilizers or amendments to optimize growth.
Even in livestock farming, standard deviation is applied to monitor weight gain, milk production, or feed efficiency. Understanding variability ensures healthier animals, better resource allocation, and more consistent output.
By applying standard deviation in agriculture, farmers and researchers can interpret complex data, identify trends, and implement targeted interventions. It turns raw measurements into actionable insights, improving crop yields, resource management, and overall farm productivity while reducing risks and inefficiencies.
Standard Deviation in Retail and Consumer Goods
In retail and consumer goods, standard deviation is a powerful tool for analyzing sales patterns, inventory variability, and customer behavior. It allows businesses to identify trends, optimize stock levels, and improve decision-making.
For example, consider a retail store tracking daily sales of a product. If the average daily sales are 300 units with a low standard deviation, sales are consistent and predictable. A high standard deviation, however, indicates wide fluctuations, which may result from seasonal demand, promotions, or unpredictable customer behavior. Understanding this variability helps managers plan inventory, marketing campaigns, and staffing more effectively.
Standard deviation is also used in pricing analysis. Retailers can measure variability in sales across different price points, identifying which products are sensitive to price changes. High variability may indicate that some prices are too high or too low for certain segments, while low variability suggests stable demand.
In supply chain management, standard deviation helps track variability in delivery times, supplier performance, and stock levels. High variability can signal delays, inefficiencies, or unreliable suppliers, prompting corrective actions to maintain smooth operations.
Additionally, customer behavior analysis benefits from standard deviation. Businesses can evaluate variability in purchase frequency, basket size, and engagement metrics. This insight allows for targeted promotions, personalized recommendations, and improved customer satisfaction.
By applying standard deviation in retail and consumer goods, companies can turn raw data into actionable insights, reduce risks, improve operational efficiency, and enhance the customer experience, ultimately driving profitability and long-term growth.
Standard Deviation in Education Policy and Assessment
Standard deviation is a key tool in education policy and assessment, helping educators and policymakers understand variability in student performance and evaluate the effectiveness of teaching methods and programs. It provides insight beyond average test scores, revealing the spread of achievement across students and schools.
For example, two schools may have the same average standardized test score, but if one school has a low standard deviation, most students perform similarly, indicating consistent teaching outcomes. A high standard deviation suggests a wide range of performance, with some students excelling while others struggle. This information is essential for targeted interventions, resource allocation, and curriculum adjustments.
Standard deviation is also used in evaluating educational programs and policies. Policymakers can compare performance across schools, districts, or regions to identify disparities and measure the impact of initiatives such as new teaching strategies, tutoring programs, or funding changes. Low variability may indicate uniform effectiveness, while high variability highlights areas needing support.
In grading and assessment, standard deviation ensures fairness and consistency. For example, when adjusting grades on a curve, educators consider variability to place students appropriately relative to peers. It also helps identify outliers who may require enrichment or remedial assistance.
By applying standard deviation in education policy and assessment, decision-makers gain a quantitative understanding of student performance and program effectiveness. This allows for data-driven strategies that improve learning outcomes, reduce achievement gaps, and ensure equitable education opportunities for all students.
Standard Deviation in Project Management and Productivity
In project management and productivity analysis, standard deviation is an essential tool for measuring variability in timelines, task completion, and performance metrics. It helps managers identify inconsistencies, anticipate risks, and optimize workflows.
For example, consider a project with an average task completion time of 5 days. If the standard deviation is low, most tasks are completed close to this timeline, indicating consistent performance and reliable scheduling. A high standard deviation, however, reveals wide fluctuations, suggesting delays or inefficiencies that could impact overall project delivery. Identifying these variations allows managers to allocate resources effectively and implement corrective measures.
Standard deviation is also valuable for tracking team productivity. By measuring variability in output across team members, managers can identify strengths, weaknesses, or training needs. Low variability signals balanced performance, while high variability may highlight areas where support or adjustments are required.
In risk management, standard deviation helps quantify uncertainty in project outcomes. Estimating potential delays, budget overruns, or performance variability allows managers to develop contingency plans, improve forecasting, and reduce surprises.
Additionally, standard deviation aids in process improvement. By analyzing historical performance data, managers can detect patterns, implement more efficient practices, and minimize variability, leading to smoother workflows and better results.
By applying standard deviation in project management, organizations gain a clear picture of variability, reliability, and risk. It turns raw data into actionable insights, enabling teams to optimize productivity, meet deadlines, and achieve project goals more effectively.
Standard Deviation in Public Policy and Governance
Standard deviation is a valuable tool in public policy and governance, helping policymakers understand variability in social, economic, and demographic data. It allows governments to make informed decisions, allocate resources effectively, and evaluate the impact of policies.
For example, consider unemployment rates across different regions of a country. If the mean unemployment rate is 6% with a low standard deviation, most regions experience similar levels, suggesting uniform economic conditions. A high standard deviation, however, indicates significant differences, highlighting areas with higher unemployment that may require targeted intervention.
Standard deviation is also critical in assessing educational outcomes, healthcare access, and income distribution. Policymakers can measure variability across populations to identify disparities, monitor progress, and implement equitable policies. For instance, a high standard deviation in healthcare access may reveal regions with poor medical services, guiding the allocation of funding, facilities, or personnel.
In budgeting and fiscal planning, standard deviation helps track variability in tax revenues, government spending, or project completion times. It enables officials to anticipate potential risks, prepare contingency plans, and ensure more stable governance.
Furthermore, standard deviation is used in survey analysis and public opinion research. Understanding variability in responses helps governments gauge consensus, detect outlier opinions, and design policies that reflect the needs of diverse populations.
By applying standard deviation, policymakers gain a quantitative understanding of variability and consistency, allowing for data-driven decisions, fair resource distribution, and effective governance. It transforms complex social and economic data into actionable insights that improve public services and societal outcomes.
Standard Deviation in Technology Product Testing
Standard deviation is a key metric in technology product testing, helping engineers, designers, and quality assurance teams measure variability in performance, reliability, and user experience. It provides a quantitative understanding of consistency, which is essential for producing high-quality products.
For example, consider testing the battery life of smartphones. If the average battery life is 10 hours with a low standard deviation, most devices perform similarly, indicating reliable performance. A high standard deviation, however, shows that some devices last much longer or shorter than average, signaling potential quality control issues or design inconsistencies.
Standard deviation is also applied in software performance testing. Metrics like response time, load handling, and processing speed can be monitored to ensure stability under different conditions. Low variability indicates that the software performs consistently, while high variability may highlight bottlenecks, bugs, or areas for optimization.
In hardware testing, standard deviation helps assess product durability and functionality. For example, sensors, processors, or mechanical components may be tested repeatedly, and deviations from expected results can reveal defects or manufacturing inconsistencies.
Even in user experience testing, standard deviation can measure variability in interaction times, error rates, or satisfaction scores across users. High variability may indicate usability issues that need to be addressed to ensure a consistent and positive user experience.
By applying standard deviation in technology product testing, companies can detect anomalies, improve quality, and deliver reliable products. It turns raw performance data into actionable insights, helping engineers optimize design, enhance efficiency, and meet customer expectations.
Standard Deviation in Supply Chain Management
Standard deviation is an essential tool in supply chain management, helping businesses measure variability in processes such as delivery times, inventory levels, and demand forecasting. Understanding this variability enables companies to optimize operations, reduce risks, and improve efficiency.
For example, consider a company tracking delivery times from suppliers. If the average delivery time is 5 days with a low standard deviation, most shipments arrive on schedule, allowing for predictable production planning. A high standard deviation indicates inconsistent delivery times, signaling potential issues with suppliers, transportation, or logistics processes that require attention.
Standard deviation is also applied in inventory management. By measuring variability in product demand, companies can better anticipate stock requirements, avoid overstocking or shortages, and maintain smooth operations. High variability in demand may indicate the need for flexible inventory strategies or just-in-time ordering.
In production planning, standard deviation helps monitor process consistency. Metrics like production cycle time, defect rates, or machine performance can be analyzed to identify inefficiencies and implement corrective actions.
Even in risk management, standard deviation quantifies uncertainty in supply chain performance, helping managers prepare for disruptions caused by seasonal fluctuations, market shifts, or unexpected events.
By applying standard deviation in supply chain management, businesses gain a quantitative understanding of variability, enabling data-driven decisions that enhance reliability, reduce costs, and improve customer satisfaction. It transforms complex operational data into actionable insights, ensuring more efficient and resilient supply chains.
Standard Deviation in Sports Analytics and Performance Metrics
Standard deviation is a powerful tool in sports analytics, helping coaches, teams, and analysts understand variability in performance and make informed decisions about training, strategy, and player management. It goes beyond averages to highlight consistency, reliability, and potential risks.
For example, consider a basketball player who averages 20 points per game. If the standard deviation is low, the player consistently scores near 20 points each game, providing predictable performance. A high standard deviation indicates more variability, with some games scoring significantly higher or lower than average. Coaches can use this information to determine when to rely on the player in critical moments or adjust training to improve consistency.
Standard deviation is also applied to team performance metrics, such as win margins, possession rates, or shot accuracy. Teams with lower variability in these metrics are generally more reliable, while higher variability may indicate unpredictable outcomes that require strategic adjustments.
In player development, standard deviation helps evaluate progress and consistency. For instance, tracking variability in sprint times, endurance, or strength tests can identify areas where athletes need targeted training.
Even in fan engagement and sports business, standard deviation can measure variability in ticket sales, merchandise revenue, or broadcast viewership, helping organizations optimize promotions and operations.
By applying standard deviation in sports analytics, teams and organizations gain a deeper understanding of performance patterns, identify risks, and make data-driven decisions that improve player development, team strategy, and overall competitiveness. It transforms raw statistics into actionable insights for better performance and outcomes.
Standard Deviation in Environmental Monitoring and Sustainability
Standard deviation is a key tool in environmental monitoring and sustainability, helping scientists, policymakers, and organizations measure variability in natural systems and assess the reliability of environmental data. It enables better planning and informed decision-making for resource management and conservation efforts.
For example, consider air quality monitoring in a city. If the average particulate matter (PM2.5) level is 40 µg/m³ with a low standard deviation, air pollution levels are relatively stable. A high standard deviation indicates wide fluctuations, signaling periods of poor air quality that may require intervention or stricter regulations.
Standard deviation is also crucial in water resource management. By measuring variability in river flow, rainfall, or groundwater levels, environmental scientists can detect anomalies, predict droughts or floods, and optimize water allocation for agriculture, industry, and communities.
In biodiversity and wildlife conservation, standard deviation helps quantify variability in species populations across habitats. Low variability suggests stable populations, while high variability may indicate environmental stress, habitat degradation, or human impact that requires targeted action.
Even in sustainable energy and emissions monitoring, standard deviation measures fluctuations in energy production, consumption, or greenhouse gas emissions. Understanding variability allows organizations to improve efficiency, reduce environmental impact, and ensure reliable energy supply.
By applying standard deviation in environmental monitoring and sustainability, stakeholders gain a quantitative understanding of variability and risk, enabling proactive measures to protect ecosystems, manage resources, and promote long-term sustainability. It transforms complex environmental data into actionable insights that support informed decision-making and sustainable development.
Standard Deviation in Healthcare Policy and Epidemiology
Standard deviation is a critical tool in healthcare policy and epidemiology, helping researchers, policymakers, and public health officials understand variability in health outcomes, disease spread, and treatment effectiveness. It provides insights beyond averages, allowing for more precise planning and decision-making.
For example, consider tracking blood pressure levels across a population. If the average systolic blood pressure is 120 mmHg with a low standard deviation, most individuals have similar readings, indicating stable health. A high standard deviation shows wide variability, highlighting subgroups at higher risk of hypertension or cardiovascular issues, which may require targeted interventions.
In epidemiology, standard deviation is used to analyze disease incidence, infection rates, and mortality trends. It helps identify regions or populations with unusually high or low rates, revealing patterns that can inform vaccination campaigns, resource allocation, and preventive strategies.
Standard deviation is also applied in clinical research and healthcare policy evaluation. For instance, when studying the effectiveness of a new treatment, low variability in patient outcomes suggests consistent benefits, while high variability may indicate that some patients respond differently, prompting further investigation.
Additionally, in public health programs, standard deviation helps monitor variability in service delivery, access to care, and patient outcomes. Understanding this variability ensures equitable distribution of resources and identifies areas requiring improvement.
By using standard deviation in healthcare policy and epidemiology, professionals gain a quantitative understanding of variability and risk, allowing for data-driven interventions, effective resource allocation, and improved population health outcomes. It transforms complex health data into actionable insights that guide policy and save lives.
Standard Deviation in Manufacturing and Industrial Processes
In manufacturing and industrial processes, standard deviation is a fundamental tool for quality control, process optimization, and performance monitoring. It measures variability in production metrics, helping ensure consistency, reliability, and efficiency.
For example, consider a factory producing metal sheets with a target thickness of 2 mm. If the standard deviation is low, most sheets are very close to the target, indicating precise manufacturing. A high standard deviation means thickness varies significantly, increasing the risk of defective products and waste. By monitoring this variability, engineers can identify issues in machinery, materials, or processes before they escalate.
Standard deviation is also widely used in control charts, which track production metrics over time. By plotting the mean, upper and lower control limits, and standard deviation, managers can quickly spot trends, outliers, and deviations that require corrective action.
In process optimization, standard deviation helps identify variability in cycle times, machine performance, or product quality. Reducing variability ensures smoother operations, higher efficiency, and lower operational costs.
Even in safety and reliability testing, standard deviation measures consistency in stress tests, material performance, or equipment operation. Components with low variability meet safety standards reliably, while high variability may indicate potential failure risks.
By applying standard deviation in manufacturing and industrial processes, companies can improve product quality, enhance operational efficiency, and minimize defects. It transforms raw performance data into actionable insights, ensuring consistent production, cost savings, and a competitive advantage in the market.
Standard Deviation in Research and Academic Studies
Standard deviation is a critical statistical tool in research and academic studies, providing insight into the variability and reliability of data. It goes beyond simple averages to reveal the spread of results, helping researchers draw meaningful conclusions and assess the accuracy of findings.
For example, in a psychology experiment measuring reaction times, researchers may record the time it takes for participants to respond to a stimulus. If the average reaction time is 250 milliseconds with a low standard deviation, most participants respond consistently, suggesting reliable results. A high standard deviation indicates greater variability, which may be due to individual differences, measurement errors, or experimental factors that require further investigation.
In scientific research, standard deviation is essential for interpreting experimental data. Researchers report results as the mean ± standard deviation to communicate both central tendency and variability, allowing others to evaluate reliability and replicate studies.
In educational studies, standard deviation helps analyze student performance, test scores, or learning outcomes. Low variability indicates consistent achievement across a group, while high variability highlights differences that may require targeted interventions or teaching adjustments.
Standard deviation is also used in medical and social science research to evaluate clinical trial outcomes, population trends, and survey results. It helps identify outliers, assess risk, and ensure data quality.
By applying standard deviation in research and academic studies, scholars gain a quantitative understanding of variability and consistency, enabling accurate interpretations, reliable conclusions, and evidence-based recommendations. It transforms raw data into actionable insights that advance knowledge and inform practice across disciplines.
Standard Deviation in Risk Assessment and Decision-Making
Standard deviation is a vital tool in risk assessment and decision-making, helping individuals and organizations quantify uncertainty and make informed choices. By measuring variability, standard deviation allows decision-makers to anticipate potential outcomes and assess the likelihood of extreme events.
For example, in financial risk assessment, investors use standard deviation to evaluate the volatility of stocks, bonds, or portfolios. A high standard deviation indicates unpredictable returns, signaling higher risk, while a low standard deviation suggests stable performance. This information guides investment strategies, asset allocation, and risk mitigation.
In business decision-making, standard deviation helps assess operational and strategic risks. Companies monitor variability in production, sales, or project timelines to identify potential bottlenecks, inefficiencies, or unexpected outcomes. Understanding this variability allows managers to plan contingencies, allocate resources effectively, and reduce the likelihood of costly surprises.
Standard deviation is also applied in project management and forecasting. By analyzing historical data, managers can estimate potential deviations from expected outcomes, such as budget overruns, delays, or demand fluctuations. This improves planning accuracy and supports proactive decision-making.
In public policy and healthcare, standard deviation helps quantify risk in population studies, treatment effectiveness, or resource allocation. High variability may indicate vulnerable groups or unpredictable outcomes, guiding targeted interventions and policy adjustments.
By incorporating standard deviation into risk assessment and decision-making, organizations and individuals gain a quantitative understanding of uncertainty, enabling smarter strategies, informed choices, and better preparedness for variability. It transforms complex data into actionable insights, reducing risk and improving outcomes across industries and sectors.
Conclusion:
Standard deviation is one of the most essential tools in statistics, providing a clear measure of variability, consistency, and risk in data.
Unlike averages, which can sometimes mask important differences, standard deviation reveals how spread out values are, offering a deeper understanding of patterns, trends, and anomalies.
Across diverse fields—from finance and business to healthcare, education, sports, and environmental science—standard deviation allows professionals to make data-driven decisions.
Investors use it to evaluate market volatility, engineers to maintain product quality, and educators to understand student performance variability. It is equally valuable in research, where it ensures that findings are interpreted correctly and reliably, and in policy-making, where it guides equitable resource allocation.
Understanding standard deviation also helps in predicting outcomes and assessing risk. A low standard deviation signals stability and consistency, while a high standard deviation highlights variability, uncertainty, or potential outliers. This knowledge is crucial for planning, optimizing processes, and mitigating unexpected challenges.
Moreover, standard deviation enhances data visualization and communication. By combining it with graphs, charts, and statistical models, professionals can present complex data clearly, making it easier to interpret and share insights with stakeholders.
In conclusion, mastering standard deviation empowers individuals and organizations to transform raw data into actionable insights, uncover hidden patterns, and make informed decisions with confidence.
Whether in science, business, education, or daily life, understanding standard deviation is key to interpreting variability accurately and leveraging data to its fullest potential.

Nikki Jorton is a Norwegian-born transgender woman and content creator who became publicly known through her relationship and marriage to American comedian and radio personality Jim Norton. The two met online and developed a long-distance relationship that faced significant immigration and legal challenges before Nikki was able to move to the United States. Their journey, marked by persistence and openness, attracted media attention for its honesty and unconventional nature. The couple married in October 2023 and now live together in New York City.