When analyzing data, most people focus on averages like the mean or median to understand a set of numbers. But averages alone don’t tell the whole story.
That’s where standard deviation comes in. Standard deviation is a statistical measure that shows how spread out numbers are in a dataset.
In simple terms, it tells you whether the numbers are clustered close to the average or scattered widely. Understanding standard deviation is essential in fields ranging from finance and science to education and sports, because it helps identify consistency, variability, and potential risks.
For example, two classrooms might have the same average test score, but the standard deviation can reveal which class has more consistent performance.
In this article, we’ll break down what standard deviation means, how it’s calculated, practical examples, and why it’s a crucial tool for making sense of data in everyday life.
The Basics of Standard Deviation
Standard deviation is one of the most important concepts in statistics because it tells us how much individual data points differ from the average (mean) of a dataset. In simple terms, it measures the “spread” or “variability” of numbers. A low standard deviation means most numbers are close to the average, while a high standard deviation indicates the numbers are more spread out.
To understand this, imagine two classrooms with the same average test score of 80. In the first classroom, most students scored between 78 and 82, resulting in a low standard deviation. In the second classroom, scores ranged from 50 to 100, producing a high standard deviation. Even though the averages are identical, the variability and therefore the story the data tells is very different.
Standard deviation is closely related to variance, which is the average of the squared differences from the mean. Taking the square root of the variance gives the standard deviation, bringing the measure back to the same units as the original data.
It’s also important to know that there are two types: population standard deviation, used when you have data for an entire group, and sample standard deviation, used when analyzing a smaller subset of the population. Understanding the basics of standard deviation helps you interpret data more accurately, make better decisions, and see patterns that averages alone cannot reveal.
How Standard Deviation is Calculated
Calculating standard deviation may sound complicated, but it becomes much easier when broken into simple steps. Standard deviation measures how far each number in a dataset is from the average, so the calculation focuses on these differences.
Here’s a step-by-step process:
- Find the mean (average) of the dataset. Add all the numbers together and divide by the total number of data points.
- Calculate the differences between each number and the mean. These differences show how far each number is from the average.
- Square each difference to make all values positive and emphasize larger deviations.
- Find the average of the squared differences, which is called the variance. For a population, divide by the total number of data points. For a sample, divide by one less than the total (n-1).
- Take the square root of the variance. This final value is the standard deviation, expressed in the same units as the original data.
Example: Consider the dataset: 4, 6, 8, 10.
- Mean = (4+6+8+10)/4 = 7
- Differences from mean: -3, -1, 1, 3
- Squared differences: 9, 1, 1, 9
- Variance = (9+1+1+9)/4 = 5
- Standard deviation = √5 ≈ 2.24
This example shows that, on average, each number is about 2.24 units away from the mean. Understanding the calculation helps you interpret data variability and compare datasets effectively.
Understanding Standard Deviation With Examples
While formulas explain how to calculate standard deviation, real-world examples help us understand what it actually represents. Standard deviation shows how data points are spread around the average, giving insight into consistency and variability.
Example 1: Classroom Test Scores
Imagine two classes with the same average score of 80. In Class A, most students scored between 78 and 82. In Class B, scores ranged from 50 to 100. Class A has a low standard deviation because scores are tightly clustered around the mean, while Class B has a high standard deviation due to wide variability. This shows that averages alone can be misleading if variability is ignored.
Example 2: Stock Market Prices
Investors use standard deviation to measure volatility. A stock with a low standard deviation has prices that stay close to the average, suggesting stability. A stock with a high standard deviation experiences frequent ups and downs, indicating higher risk.
Example 3: Weather Data
Daily temperatures over a week can also illustrate standard deviation. If temperatures vary only slightly day to day, the standard deviation is low. In contrast, if there are sudden heatwaves or cold snaps, the standard deviation is higher, showing greater variability.
By examining these examples, it becomes clear that standard deviation is more than just a number it provides a deeper understanding of data patterns. Whether in education, finance, or daily life, recognizing variability helps you make better decisions and interpret data more accurately.
Why Standard Deviation is Important
Understanding standard deviation is crucial because it provides insights that averages alone cannot. While the mean tells us the “typical” value in a dataset, standard deviation measures how much the data varies from that average. This knowledge is valuable in many fields, from finance and science to education and sports.
In finance, investors use standard deviation to assess risk. A stock with a high standard deviation has unpredictable price movements, signaling greater risk, while a stock with a low standard deviation is more stable. Knowing this helps investors make informed decisions about where to put their money.
In science and research, standard deviation is used to evaluate the reliability of measurements. Experiments often produce slightly different results, and a low standard deviation indicates consistent, repeatable outcomes. Conversely, a high standard deviation may signal errors or unusual variability in the data.
In education, teachers and administrators analyze test scores using standard deviation to identify how consistent student performance is. Two classes may have the same average score, but the class with a lower standard deviation shows more consistent learning outcomes.
Even in daily life, standard deviation helps make sense of patterns. Weather variations, sports performance, and product quality all benefit from understanding variability. By analyzing standard deviation, we gain a clearer, more complete picture of data, allowing for smarter decisions, better predictions, and a deeper understanding of the world around us.
Common Misconceptions About Standard Deviation
Although standard deviation is a fundamental concept in statistics, it is often misunderstood. Clearing up common misconceptions helps ensure that data is interpreted correctly.
Misconception 1: Standard deviation measures error or mistakes.
Some people think a high standard deviation means something is “wrong” with the data. In reality, it simply measures variability. High standard deviation indicates that values are spread out, not that they are incorrect.
Misconception 2: Low standard deviation is always better.
While low standard deviation shows consistency, it isn’t always ideal. For example, in investments, a low standard deviation may indicate stability, but it could also mean minimal growth potential. Similarly, in education, a low standard deviation may reflect uniformity, but it doesn’t necessarily mean high performance.
Misconception 3: Standard deviation is the same as variance.
Variance is related to standard deviation, but they are not identical. Variance measures the average squared deviations from the mean, while standard deviation is the square root of variance. Standard deviation is preferred when comparing datasets because it is in the same units as the original data.
Misconception 4: Standard deviation works for any type of data.
Standard deviation assumes numerical, continuous data and can be misleading with categorical or highly skewed datasets. Using it inappropriately may lead to incorrect conclusions.
By understanding these misconceptions, readers can interpret standard deviation more accurately, use it effectively in decision-making, and avoid common pitfalls in data analysis. Recognizing what standard deviation truly represents variability ensures clearer insights across fields like finance, science, and education.
Tools to Calculate Standard Deviation
Calculating standard deviation manually is useful for understanding the concept, but in real life, datasets are often too large for hand calculations. Fortunately, there are several tools that make it easy to calculate standard deviation quickly and accurately.
1. Excel and Google Sheets
Spreadsheet software is one of the most popular ways to calculate standard deviation. In Excel, the functions STDEV.P (for population) and STDEV.S (for sample) allow you to compute standard deviation instantly. Google Sheets offers the same functions. Simply select your data range, enter the function, and the standard deviation is calculated automatically.
2. Calculators
Many scientific calculators include a standard deviation function. You can input your dataset, and the calculator will display the standard deviation. This is ideal for small to medium-sized datasets.
3. Programming Languages
For larger datasets or automated analysis, programming languages like Python or R are highly effective. In Python, the statistics library provides the stdev() and pstdev() functions, while R uses the sd() function. These tools allow you to calculate standard deviation for datasets with thousands or millions of entries.
4. Online Tools
Several free online calculators allow users to input numbers or upload spreadsheets to compute standard deviation instantly. They are convenient for quick calculations without software installation.
Using the right tool depends on your dataset size and needs. For beginners, Excel or online calculators are sufficient. For professionals handling large datasets, programming offers flexibility, speed, and precision. Understanding these tools ensures that calculating standard deviation is no longer a challenge.
Real-World Applications of Standard Deviation
Understanding standard deviation is not just a mathematical exercise it has practical applications in many areas of life and work. By measuring how spread out data is, standard deviation helps interpret results, assess risk, and make informed decisions.
Finance: Investors use standard deviation to measure stock volatility. A stock with a high standard deviation experiences wide price swings, indicating higher risk, while a low standard deviation suggests stable performance. Portfolio managers rely on this metric to balance risk and returns.
Science and Research: In laboratories, standard deviation is used to evaluate consistency and reliability of experimental results. A low standard deviation shows that repeated measurements are consistent, while a high standard deviation may indicate measurement errors or unexpected variability.
Education: Teachers and administrators analyze student test scores using standard deviation to understand performance consistency. Two classes may have the same average score, but the class with a lower standard deviation demonstrates more uniform learning outcomes.
Sports: Coaches use standard deviation to evaluate player performance. For example, a basketball player with scores consistently close to their average demonstrates reliability, whereas high variability might indicate inconsistency.
Everyday Life: Standard deviation helps interpret weather patterns, product quality, and other daily measurements. It provides context beyond averages, helping people understand trends and make better decisions.
By applying standard deviation in these areas, we gain a deeper understanding of variability, improve forecasting, and make smarter choices, whether in professional settings or day-to-day life.
Visualizing Standard Deviation
Understanding standard deviation becomes much easier when data is visualized. Graphs and charts help illustrate how spread out values are around the mean, making abstract numbers more intuitive.
1. Histograms
A histogram displays the frequency of data points in intervals. By looking at the width and shape of the histogram, you can quickly see variability. A narrow, tall histogram indicates a low standard deviation, where most data points are near the mean. A wide, flat histogram shows a high standard deviation, with values spread over a larger range.
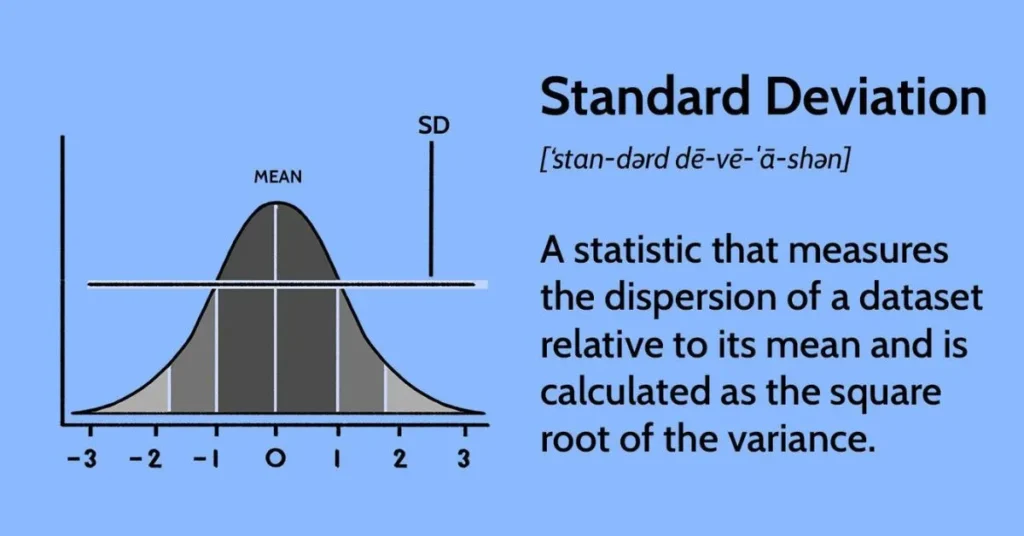
2. Bell Curves (Normal Distribution)
Many datasets, like test scores or heights, follow a normal distribution. In a bell curve, the mean is at the center, and standard deviation determines the curve’s spread. About 68% of values fall within one standard deviation of the mean, 95% within two, and 99.7% within three. This visual makes it easy to interpret how typical or unusual a value is.
3. Line Graphs and Error Bars
Line graphs with error bars can also show standard deviation. Error bars extend above and below data points, representing variability. Longer bars indicate higher standard deviation, while shorter bars indicate consistency.
Visualizing standard deviation helps readers grasp data variability quickly, identify outliers, and make comparisons across datasets. Whether in classrooms, laboratories, or financial reports, using graphs alongside numbers ensures a clearer understanding of patterns and trends. Visualization transforms standard deviation from an abstract number into an insightful tool for real-world analysis.
Section 9: FAQs About Standard Deviation
1. What is the difference between standard deviation and variance?
Variance measures the average of the squared differences from the mean, while standard deviation is the square root of variance. Standard deviation is expressed in the same units as the original data, making it easier to interpret.
2. Can standard deviation be negative?
No. Standard deviation represents a distance from the mean and is always a non-negative value. A value of zero means all data points are identical.
3. Is a higher standard deviation always bad?
Not necessarily. A high standard deviation indicates greater variability, but whether this is “good” or “bad” depends on the context. For example, high variability in investment returns may indicate risk but also the potential for higher profit.
4. Can standard deviation be used for any type of data?
Standard deviation works best with numerical, continuous data. Using it for categorical or highly skewed data can be misleading.
5. How does standard deviation relate to probability?
In a normal distribution, standard deviation helps predict the likelihood of a value falling within a certain range. About 68% of values fall within one standard deviation of the mean, 95% within two, and 99.7% within three.
6. Why is standard deviation important?
It provides insight into data variability, consistency, and reliability, helping in decision-making across fields like finance, science, education, and daily life.
By answering these common questions, readers can better understand how to interpret and use standard deviation in real-world situations.
Conclusion
Standard deviation is more than just a mathematical formula it is a powerful tool for understanding data variability. While averages provide a general sense of what is typical in a dataset, standard deviation reveals how much individual data points differ from the mean.
This insight is crucial for making accurate interpretations and informed decisions across many fields.
In finance, standard deviation helps investors assess risk and predict potential returns. In science and research, it indicates the reliability of measurements and the consistency of experiments.
Educators use it to understand student performance patterns, while coaches analyze player consistency in sports. Even in everyday life, standard deviation helps interpret trends in weather, product quality, and other measurable phenomena.
By learning how to calculate, interpret, and visualize standard deviation, readers gain a deeper understanding of data. Tools like Excel, Google Sheets, Python, and online calculators make computation easier, while charts and graphs provide visual clarity.
Understanding common misconceptions ensures proper application and prevents misinterpretation.
Ultimately, standard deviation transforms raw numbers into meaningful insights. It empowers us to see beyond averages, identify patterns, evaluate risk, and make better decisions.
By mastering this concept, anyone from students to professionals can unlock the full story that their data is trying to tell.

Jordon Fox is an emerging artist and creative from Philadelphia, Pennsylvania, known for blending music, fashion, and fitness into his personal brand and artistic identity. He’s built a reputation as a multi-talented creator with a strong focus on authenticity and inspiring others.